Rutherglen (UK Parliament constituency)
Glasgow Rutherglen | |
---|---|
Former Burgh constituency for the House of Commons | |
1918–2005 | |
Seats | One |
Created from | Mid Lanarkshire |
Replaced by | Rutherglen and Hamilton West Glasgow Central Glasgow South |
Rutherglen (from 1983, Glasgow Rutherglen) was a burgh constituency represented in the House of Commons of the Parliament of the United Kingdom from 1918 until 2005. From 2005, most of the area is represented by Rutherglen and Hamilton West, while a small portion is now in Glasgow Central and Glasgow South.
The constituency is to be re-established, as part of the 2023 Periodic Review of Westminster constituencies and under the final recommendations of the Boundary Commission for Scotland for the 2024 United Kingdom general election, succeeding the constituency of Rutherglen and Hamilton West.[1][2]
Boundaries[edit]
-
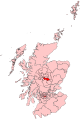
Map of the constituency in Scotland, from 2024
-
Map of the constituency in Lanarkshire electoral region, 1950 boundary
1918–1949: "The burgh of Rutherglen and the parts of the Lower Ward and Middle Ward County Districts which are contained within the parishes of Carmunnock, Cambuslang, and Blantyre, and the extra-burghal portion of the parish of Rutherglen."
1950–1974: The Burgh of Rutherglen, and the eighth district [of Lanarkshire].[3]
1974–1983: The Burgh of Rutherglen, and the eighth district.[4]
1983–1997: The City of Glasgow District electoral divisions of Toryglen/Rutherglen, Glenwood/Fernhill, and Cambuslang/Halfway.[5]
Since 2024: The South Lanarkshire council wards of Blantyre, Bothwell and Uddingston, Cambuslang East, Cambuslang West, Rutherglen Central and North, and Rutherglen South.[6]
Members of Parliament[edit]
Elections[edit]
Elections in the 2020s[edit]
Party | Candidate | Votes | % | ±% | |
---|---|---|---|---|---|
Scottish Socialist | Bill Bonnar[8] | ||||
Alba | Jim Eadie | ||||
SNP | Katy Loudon[9] | ||||
Labour | Michael Shanks[10] | ||||
Reform UK | David Stark[11] | ||||
Majority | |||||
Turnout | |||||
Registered electors | |||||
win (new seat) |
Elections in the 2000s[edit]
Party | Candidate | Votes | % | ±% | |
---|---|---|---|---|---|
Labour Co-op | Tommy McAvoy | 16,760 | 57.4 | −0.1 | |
SNP | Anne McLaughlin | 4,135 | 14.1 | −1.2 | |
Liberal Democrats | David Jackson | 3,689 | 12.6 | −1.9 | |
Conservative | Malcolm MacAskill | 3,301 | 11.3 | +2.0 | |
Scottish Socialist | Bill Bonnar | 1,328 | 4.5 | +3.8 | |
Majority | 12,625 | 43.3 | +1.1 | ||
Turnout | 29,213 | 56.3 | −13.8 | ||
Registered electors | 51,855 | ||||
Labour hold | Swing | +0.5 |
Elections in the 1990s[edit]
Party | Candidate | Votes | % | ±% | |
---|---|---|---|---|---|
Labour Co-op | Tommy McAvoy | 20,430 | 57.52 | +4.14 | |
SNP | Ian Gray | 5,423 | 15.27 | -0.31 | |
Liberal Democrats | Robert Brown | 5,167 | 14.55 | +2.89 | |
Conservative | David Campbell Bannerman | 3,288 | 9.26 | -9.90 | |
Independent Labour | George Easton | 812 | 2.29 | New | |
Scottish Socialist | Rosie Kane | 251 | 0.71 | New | |
Referendum | Julia Kerr | 150 | 0.42 | New | |
Majority | 15,007 | 42.25 | +3.75 | ||
Turnout | 35,521 | 70.10 | -5.12 | ||
Registered electors | 50,673 | ||||
Labour hold | Swing | +2.22 |
Party | Candidate | Votes | % | ±% | |
---|---|---|---|---|---|
Labour Co-op | Tommy McAvoy | 21,962 | 55.38 | -0.63 | |
Conservative | Brian Cooklin | 6,692 | 16.88 | +5.38 | |
SNP | John Higgins | 6,470 | 16.32 | +8.22 | |
Liberal Democrats | David Baillie | 4,470 | 11.27 | -13.12 | |
International Communist Party | Barbara Slaughter | 62 | 0.16 | New | |
Majority | 15,270 | 38.50 | +6.88 | ||
Turnout | 39,656 | 75.22 | -2.00 | ||
Registered electors | 52,719 | ||||
Labour hold | Swing | -3.01 |
Elections in the 1980s[edit]
Party | Candidate | Votes | % | ±% | |
---|---|---|---|---|---|
Labour Co-op | Tommy McAvoy | 24,790 | 56.01 | +7.67 | |
Liberal | Robert Brown | 10,795 | 24.39 | -3.44 | |
Conservative | Graeme Hamilton | 5,088 | 11.50 | -6.52 | |
SNP | John Higgins | 3,584 | 8.10 | +2.62 | |
Majority | 13,995 | 31.62 | +11.11 | ||
Turnout | 44,257 | 77.22 | +2.07 | ||
Registered electors | 57,313 | ||||
Labour hold | Swing | +5.56 |
Party | Candidate | Votes | % | ±% | |
---|---|---|---|---|---|
Labour | Gregor Mackenzie | 21,510 | 48.34 | -2.40 | |
Liberal | Robert Brown | 12,384 | 27.83 | +11.18 | |
Conservative | Helen Hodgins | 8,017 | 18.02 | -5.15 | |
SNP | Kenneth Fee | 2,438 | 5.48 | -3.79 | |
Workers Revolutionary | Christopher Corrigan | 148 | 0.33 | New | |
Majority | 9,126 | 20.51 | +0.31 | ||
Turnout | 44,497 | 75.15 | -5.27 | ||
Registered electors | 59,209 | ||||
Labour hold | Swing | -6.79 |
Elections in the 1970s[edit]
Party | Candidate | Votes | % | ±% | |
---|---|---|---|---|---|
Labour | Gregor Mackenzie | 18,546 | 46.70 | +2.31 | |
Conservative | Paul Burns | 10,523 | 26.50 | +2.47 | |
Liberal | Robert Brown | 7,315 | 18.42 | +12.12 | |
SNP | Michael Grieve | 3,325 | 8.37 | -16.91 | |
Majority | 8,023 | 20.20 | +1.09 | ||
Turnout | 39,709 | 80.42 | +1.58 | ||
Registered electors | 49,379 | ||||
Labour hold | Swing | -0.08 |
Party | Candidate | Votes | % | ±% | |
---|---|---|---|---|---|
Labour | Gregor Mackenzie | 17,099 | 44.39 | -3.19 | |
SNP | Ian Ogilvie Bayne | 9,732 | 25.28 | +10.04 | |
Conservative | John Thomson | 9,248 | 24.03 | -13.14 | |
Liberal | Robert Brown | 2,424 | 6.30 | New | |
Majority | 7,356 | 19.11 | +8.70 | ||
Turnout | 38,492 | 78.84 | -3.78 | ||
Registered electors | 48,824 | ||||
Labour hold | Swing | -6.61 |
Party | Candidate | Votes | % | ±% | |
---|---|---|---|---|---|
Labour | Gregor Mackenzie | 19,005 | 47.58 | -4.70 | |
Conservative | John Thomson | 14,852 | 38.17 | -6.16 | |
SNP | Louisa Leslie | 6,089 | 15.24 | New | |
Majority | 4,153 | 10.41 | +1.46 | ||
Turnout | 39,946 | 82.62 | +3.11 | ||
Registered electors | 48,351 | ||||
Labour hold | Swing | +0.73 |
Party | Candidate | Votes | % | ±% | |
---|---|---|---|---|---|
Labour | Gregor Mackenzie | 17,751 | 52.28 | -1.82 | |
Conservative | Peter C Hutchison | 14,710 | 43.33 | +3.80 | |
Independent Scottish Nationalist | David H Livingstone | 1,490 | 4.39 | New | |
Majority | 3,041 | 8.95 | -5.62 | ||
Turnout | 33,951 | 79.51 | -4.71 | ||
Registered electors | 42,702 | ||||
Labour hold | Swing | -2.81 |
Elections in the 1960s[edit]
Party | Candidate | Votes | % | ±% | |
---|---|---|---|---|---|
Labour | Gregor Mackenzie | 18,621 | 54.10 | +1.50 | |
Conservative | John H Young | 13,607 | 39.53 | -3.27 | |
SNP | Andrew Peacock | 2,194 | 6.37 | +1.77 | |
Majority | 5,014 | 14.57 | +4.77 | ||
Turnout | 34,422 | 84.22 | -2.00 | ||
Registered electors | 40,870 | ||||
Labour hold | Swing | +2.39 |
Party | Candidate | Votes | % | ±% | |
---|---|---|---|---|---|
Labour | Gregor Mackenzie | 18,943 | 52.60 | +4.67 | |
Unionist | Iain Sproat | 15,413 | 42.80 | -9.27 | |
SNP | Robert N Armstrong | 1,657 | 4.60 | New | |
Majority | 3,530 | 9.80 | N/A | ||
Turnout | 36,013 | 86.22 | +0.37 | ||
Registered electors | 41,771 | ||||
Labour gain from Unionist | Swing | +6.97 |
Party | Candidate | Votes | % | ±% | |
---|---|---|---|---|---|
Labour | Gregor Mackenzie | 18,885 | 55.51 | +7.58 | |
Unionist | Iain Sproat | 15,138 | 44.49 | -7.58 | |
Majority | 3,747 | 11.02 | N/A | ||
Turnout | 34,023 | ||||
Labour gain from Unionist | Swing | +7.6 |
Elections in the 1950s[edit]
Party | Candidate | Votes | % | ±% | |
---|---|---|---|---|---|
Unionist | Richard Brooman-White | 19,146 | 52.07 | -0.83 | |
Labour | Eddie Milne | 17,624 | 47.93 | +0.83 | |
Majority | 1,522 | 4.14 | -1.67 | ||
Turnout | 36,770 | 85.85 | +1.74 | ||
Registered electors | 42,833 | ||||
Unionist hold | Swing | -0.83 |
Party | Candidate | Votes | % | ±% | |
---|---|---|---|---|---|
Unionist | Richard Brooman-White | 19,141 | 52.90 | +2.45 | |
Labour | Gilbert McAllister | 17,040 | 47.10 | -2.45 | |
Majority | 2,101 | 5.80 | +4.90 | ||
Turnout | 36,181 | 84.11 | -3.63 | ||
Registered electors | 43,016 | ||||
Unionist hold | Swing | +2.45 |
Party | Candidate | Votes | % | ±% | |
---|---|---|---|---|---|
Unionist | Richard Brooman-White | 19,554 | 50.45 | +2.76 | |
Labour | Gilbert McAllister | 19,202 | 49.55 | +0.02 | |
Majority | 352 | 0.90 | N/A | ||
Turnout | 38,756 | 87.74 | +1.65 | ||
Registered electors | 44,173 | ||||
Unionist gain from Labour | Swing | +1.37 |
Elections in the 1940s[edit]
Party | Candidate | Votes | % | ±% | |
---|---|---|---|---|---|
Labour | Gilbert McAllister | 24,738 | 59.65 | +10.36 | |
Unionist | Allan Chapman | 16,736 | 40.35 | -10.36 | |
Majority | 8,002 | 19.30 | N/A | ||
Turnout | 41,474 | 76.55 | -3.44 | ||
Registered electors | 54,180 | ||||
Labour gain from Unionist | Swing | +10.36 |
Elections in the 1930s[edit]
Party | Candidate | Votes | % | ±% | |
---|---|---|---|---|---|
Unionist | Allan Chapman | 20,712 | 50.71 | -6.10 | |
Labour | David Hardie | 20,131 | 49.29 | +6.10 | |
Majority | 581 | 1.42 | -12.20 | ||
Turnout | 40,843 | 79.99 | -1.62 | ||
Registered electors | 51,063 | ||||
Unionist hold | Swing | -6.10 |
Party | Candidate | Votes | % | ±% | |
---|---|---|---|---|---|
Unionist | Herbert Moss | 22,185 | 56.81 | +20.3 | |
Labour | David Hardie | 16,866 | 43.19 | -9.0 | |
Majority | 5,319 | 13.62 | N/A | ||
Turnout | 39,051 | 81.61 | +5.9 | ||
Registered electors | 47,848 | ||||
Unionist gain from Labour | Swing | +14.65 |
Party | Candidate | Votes | % | ±% | |
---|---|---|---|---|---|
Labour | David Hardie | 16,736 | 51.3 | -0.9 | |
Unionist | Herbert Moss | 15,853 | 48.7 | +12.2 | |
Majority | 883 | 2.6 | -13.1 | ||
Turnout | 32,589 | 69.6 | -6.1 | ||
Labour hold | Swing | -5.7 |
Elections in the 1920s[edit]
Party | Candidate | Votes | % | ±% | |
---|---|---|---|---|---|
Labour | William Wright | 17,538 | 52.2 | +0.1 | |
Unionist | Arthur Patterson Duffes | 12,249 | 36.5 | −11.4 | |
Liberal | James MacDougall | 2,945 | 8.8 | New | |
Communist | Alex Moffat | 842 | 2.5 | New | |
Majority | 5,289 | 15.7 | +11.5 | ||
Turnout | 33,574 | 75.7 | −4.4 | ||
Registered electors | 44,378 | ||||
Labour hold | Swing | +5.8 |
Party | Candidate | Votes | % | ±% | |
---|---|---|---|---|---|
Labour | William Wright | 13,796 | 52.1 | −2.4 | |
Unionist | Robert McLaren | 12,707 | 47.9 | +15.8 | |
Majority | 1,089 | 4.2 | −18.2 | ||
Turnout | 26,503 | 80.1 | +7.8 | ||
Registered electors | 33,081 | ||||
Labour hold | Swing | −9.1 |
Party | Candidate | Votes | % | ±% | |
---|---|---|---|---|---|
Labour | William Wright | 13,021 | 54.5 | −0.6 | |
Unionist | Robert McLaren | 7,652 | 32.1 | New | |
Liberal | John Taylor | 3,201 | 13.4 | −31.5 | |
Majority | 5,369 | 22.4 | +12.2 | ||
Turnout | 23,874 | 72.3 | −6.1 | ||
Registered electors | 33,007 | ||||
Labour hold | Swing | +15.5 |
Party | Candidate | Votes | % | ±% | |
---|---|---|---|---|---|
Labour | William Wright | 14,029 | 55.1 | +14.2 | |
National Liberal | John Train | 11,440 | 44.9 | −14.2 | |
Majority | 2,589 | 10.2 | N/A | ||
Turnout | 25,469 | 78.4 | +21.4 | ||
Registered electors | 32,487 | ||||
Labour gain from Liberal | Swing | +14.2 |
Elections in the 1910s[edit]
Party | Candidate | Votes | % | ±% | |
---|---|---|---|---|---|
C | Liberal | Adam Keir Rodger | 12,641 | 59.1 | |
Labour | William Regan | 8,759 | 40.9 | ||
Majority | 3,882 | 18.2 | |||
Turnout | 21,400 | 57.0 | |||
Registered electors | 37,518 | ||||
Liberal win (new seat) | |||||
C indicates candidate endorsed by the coalition government. |
References[edit]
- ^ "2023 Review of UK Parliament Constituencies Boundary Commission for Scotland Final Recommendations laid before Parliament" (PDF). 28 June 2023.
- ^ Rutherglen: New Boundaries 2023 Calculation, Electoral Calculus
- ^ "Representation of the People Act 1948: Schedule 1", legislation.gov.uk, The National Archives, 1948 c. 65 (sch. 1), retrieved 22 December 2023
- ^ "The Parliamentary Constituencies (Scotland) Order 1970", legislation.gov.uk, The National Archives, SI 1970/1680, retrieved 22 December 2023
- ^ "The Parliamentary Constituencies (Scotland) Order 1983", legislation.gov.uk, The National Archives, SI 1983/422, retrieved 22 December 2023
- ^ Boundary Commission for Scotland (June 2023). 2023 Review of UK Parliament Constituency Boundaries in Scotland (PDF) (Report). p. 92. ISBN 978-1-5286-3892-0. Retrieved 7 April 2024.
- ^ From a pawnbrokers to Parliament - Tommy McAvoy looks back on a career that took him to the House of Lords, Marc McLean, Daily Record, 11 September 2018. Retrieved 1 January 2022.
- ^ "4 July General Election: Drive out ALL shades of Tories". 22 May 2024.
- ^ https://twitter.com/katyloudonsnp
- ^ https://www.glasgowtimes.co.uk/news/23513828.labour-pick-man-ran-every-glasgow-street-margaret-ferrier-seat/
- ^ https://www.reformparty.uk/rutherglen-constituency
- ^ "Election Data 2001". Electoral Calculus. Archived from the original on 15 October 2011. Retrieved 28 June 2017.
- ^ a b Kimber, Richard. "Glasgow Rutherglen". Political Science Resources.
- ^ "Election Data 1997". Electoral Calculus. Archived from the original on 15 October 2011. Retrieved 28 June 2017.
- ^ "Election Data 1992". Electoral Calculus. Archived from the original on 15 October 2011. Retrieved 28 June 2017.
- ^ "'Glasgow Rutherglen', June 1983 up to May 1997". ElectionWeb Project. Cognitive Computing Limited. Archived from the original on 6 March 2016. Retrieved 24 March 2016.
- ^ Kimber, Richard. "UK General Election results April 1992". Political Science Resources. Retrieved 24 March 2016.
- ^ "Election Data 1987". Electoral Calculus. Archived from the original on 15 October 2011. Retrieved 28 June 2017.
- ^ Kimber, Richard. "UK General Election results June 1987". Political Science Resources. Retrieved 24 March 2016.
- ^ "Election Data 1983". Electoral Calculus. Archived from the original on 15 October 2011. Retrieved 28 June 2017.
- ^ Kimber, Richard. "UK General Election results June 1983". Political Science Resources. Retrieved 24 March 2016.
- ^ a b c "'Rutherglen', Feb 1974 - May 1983". ElectionWeb Project. Cognitive Computing Limited. Archived from the original on 3 April 2016. Retrieved 24 March 2016.
- ^ Kimber, Richard. "UK General Election results 1979". Political Science Resources. Retrieved 24 March 2016.
- ^ Kimber, Richard. "UK General Election results October 1974". Political Science Resources. Retrieved 24 March 2016.
- ^ Kimber, Richard. "UK General Election results February 1974". Political Science Resources. Retrieved 24 March 2016.
- ^ Kimber, Richard. "UK General Election results 1970". Political Science Resources. Retrieved 17 April 2016.
- ^ Kimber, Richard. "UK General Election results 1966". Political Science Resources. Retrieved 17 April 2016.
- ^ Kimber, Richard. "UK General Election results 1964". Political Science Resources. Retrieved 17 April 2016.
- ^ Kimber, Richard. "UK General Election results 1959". Political Science Resources. Retrieved 17 April 2016.
- ^ Kimber, Richard. "UK General Election results 1955". Political Science Resources. Retrieved 17 April 2016.
- ^ a b Kimber, Richard. "UK General Election results 1951". Political Science Resources. Retrieved 17 April 2016.
- ^ Kimber, Richard. "UK General Election results 1945". Political Science Resources. Retrieved 17 April 2016.
- ^ Whitaker's Almanack, 1939
- ^ Kimber, Richard. "UK General Election results 1935". Political Science Resources. Retrieved 17 April 2016.
- ^ Whitaker's Almanack, 1934
- ^ Kimber, Richard. "UK General Election results 1931". Political Science Resources. Retrieved 17 April 2016.
- ^ The Times, 23 May 1931
- ^ The Times, 1 June 1929
- ^ Oliver & Boyd's Edinburgh Almanack, 1927
- ^ The Times, 8 December 1923
- ^ The Times, 17 November 1922
- ^ Whitaker's Almanack, 1920
- Craig, F. W. S. (1983) [1969]. British parliamentary election results 1918-1949 (3rd ed.). Chichester: Parliamentary Research Services. ISBN 0-900178-06-X.
- Leigh Rayment's Historical List of MPs – Constituencies beginning with "R" (part 2)
- Historic parliamentary constituencies in Scotland (Westminster)
- Constituencies of the Parliament of the United Kingdom established in 1918
- Constituencies of the Parliament of the United Kingdom disestablished in 2005
- Cambuslang
- Politics of Glasgow
- Rutherglen
- Politics of South Lanarkshire
- Proposed constituencies of the Parliament of the United Kingdom
- Blantyre, South Lanarkshire
- Bothwell and Uddingston